![]()
![]()
| Background | Factors | Game Pace | Shooting Percentages | Points | Rebounding | Assists | Steals | Blocked Shots | Turnovers | Personal Fouls | Tendencies |
![]()
Below are some historic trends showing how Kentucky has fared against the national average in terms of things like shooting percentages, points scored etc. The information for the NCAA comes from historical NCAA information provided on their official website (Direct link). Generally information only goes back to the late 1940's however. Information for Kentucky and Kentucky's opponents come from the database used to generate this site. A page with much of the raw data is available here, with opponent information available on each year's schedule page.
![]()
There are at least three types of factors to consider when viewing these trends: 1.) The coach of Kentucky at the time 2.) rules changes which may or may not have affected the game and 3.) other changes in college basketball which may have affected the game. Coaching changes and major rules changes are marked on many of the plots as a guide.
Coaching
It is instructive when viewing this information to consider the coach at that time and their coaching philosophy and points of emphasis. You may want to refer to the below table to determine which years each coach was at UK. A more complete list is at the following link.
| Years | Coach | Years | Record | Win % |
|---|---|---|---|---|
| 1928-30 | John Mauer | 3 | 40-14 | 74.0 |
| 1931-72 | Adolph Rupp | 42 | 876-190 | 82.2 |
| 1973-85 | Joe B. Hall | 13 | 297-100 | 74.8 |
| 1986-89 | Eddie Sutton | 4 | 88-39 | 69.3 |
| 1990-97 | Rick Pitino | 8 | 219-50 | 81.4 |
| 1998-2007 | Orlando Smith | 10 | 263-83 | 76.0 |
| 2008-2009 | Billy Gillispie | 2 | 40-27 | 59.7 |
| 2009-present | John Calipari | 14 | 387-113 | 77.4 |
Rules Changes
The game of basketball has evolved throughout its existence, and a large part can be traced to changes in the rules of the game itself. Below is a list of some of the major rules changes over the years, which may or may not have impacted the trends you see below. (and in some cases the rules changes may have been instituted to counteract some of the preexisting trends.)
| Year | Change |
|---|---|
| 1924 | Free Throws no longer awarded for non-contact violations |
| 1933 | Ten second backcourt rule |
| 1936 | Three-second lane violation (Edwards rule) |
| 1938 | Center jump eliminated after field goals |
| 1944 | Defensive goaltending outlawed (Mikan rule) Five foul disqualification (instead of four) |
| 1956 | Twelve-foot lane replaces six-foot lane |
| 1958 | Offensive goaltending outlawed (Chamberlain rule) |
| 1968 | Dunk Shot banned (Alcindor rule) |
| 1977 | Dunk Shot made legal again |
| 1986 | 45-second shot clock |
| 1987 | Three point line instituted |
| 1994 | 35-second shot clock |
| 2009 | Three-point line moved back to 20 feet 9 inches (from 19'-9") |
| 2016 | Shot clock reduced to 30 seconds (from 35) |
| 2020 | Three-point line moved back to 22 feet 1-3/4 inches (from 20'-9") |
The NCAA trends themselves are useful guides since it illustrates how the different statistical measures (which reflect the game itself) tend to evolve with time.
Other Changes
There are many other changes in the game which certainly affected the game and in some cases are reflected in the trends. These changes may have been more gradual and thus their effect cannot be clearly marked. Examples include rule changes as to how often the clock was stopped and thus how much playing time was actually available, large-scale integration of programs in the 1960's and early 1970's, the adoption of the fast break in the 1940's, adoption of superior shooting techniques (i.e. the jump shot etc.), improvements in equipment and conditioning, an emphasis on stalling tactics in the 1970's, an emphasis on physical play and defense in the late 1980's and 90's etc.
![]()
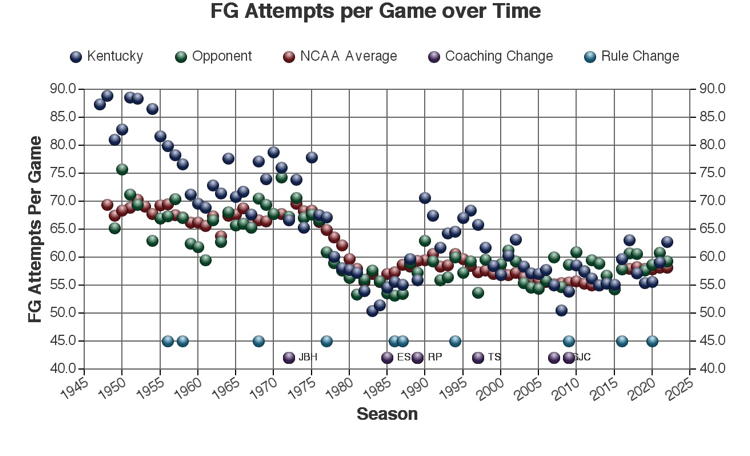
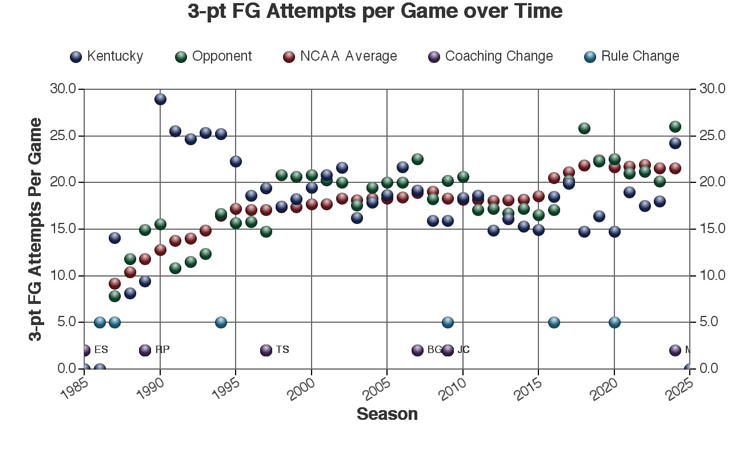
These measures illustrate the number of shots, field goal attempts etc. to reflect the pace of basketball games through time.
Field Goal Attempts per Game
 |
3-pt Field Goal Attempts per Game
 |
Possessions per Game
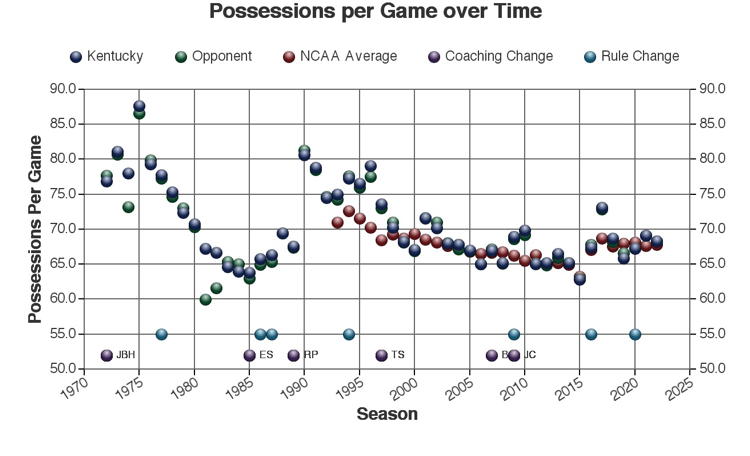 |
Note: Possessions are calculated based on the formula provided in the book Basketball on Paper by Dean Oliver (Brasseys, 2004) on page 28. The formula is Possessions = FGA - (OREB / (OREB + DDREB)) x (FGA - FGM) x 1.07 + TO + 0.4 x FTA. In this equation OREB is offensive rebounds and DDREB is the defensive rebounds of the opposing teams. Offensive rebound information for Kentucky is only available to 1993, however offensive and defensive rebounds for UK and their opponents was estimated by assuming 35% of all rebounds were of the offensive variety and 61% were of the defensive variety. (These factors based on analyzing the historical UK data back to 1993). Similarly, the NCAA does not provide offensive and defensive rebound information, so these also were estimated. The NCAA also does not provide turnover information from before 1993, so NCAA possessions are not calculated or estimated prior to that date.
![]()
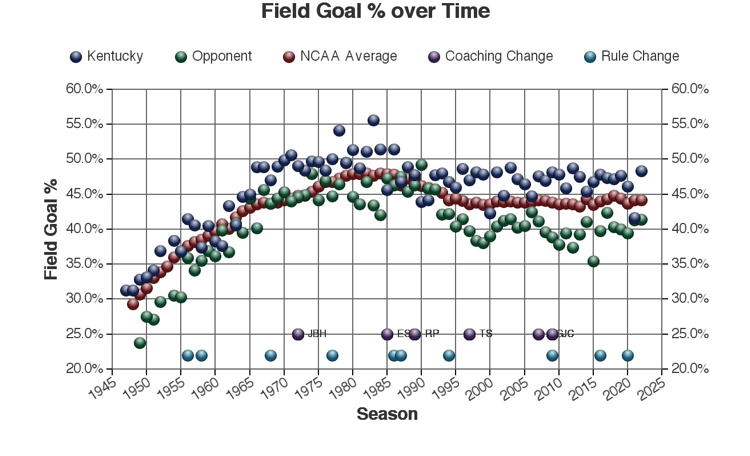
Overall Field Goal Percentage
 |
Free Throw Percentage
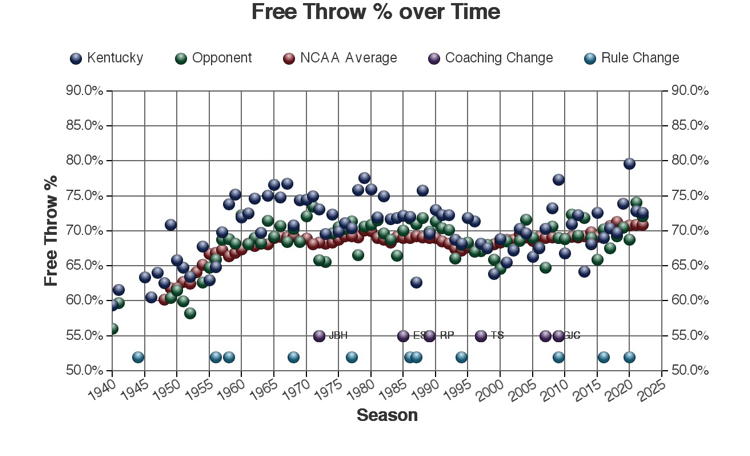 |
3-pt Field Goal Percentage
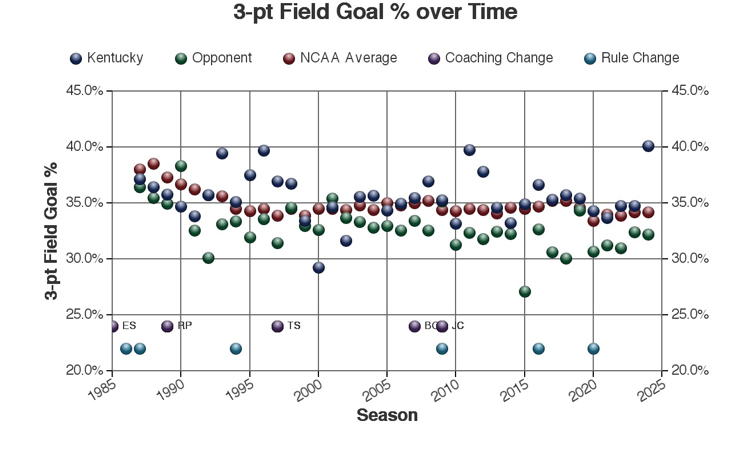 |
Adjusted Field Goal Percentage
Note: this measure subtracts out all three point shots and determines the percentage of two-point shots only. There is a slight shift in the NCAA average the year the 3-point shot was enacted, likely due to the fact that long shots prior to the rule were 2-point shots, not three-point shots.
 |
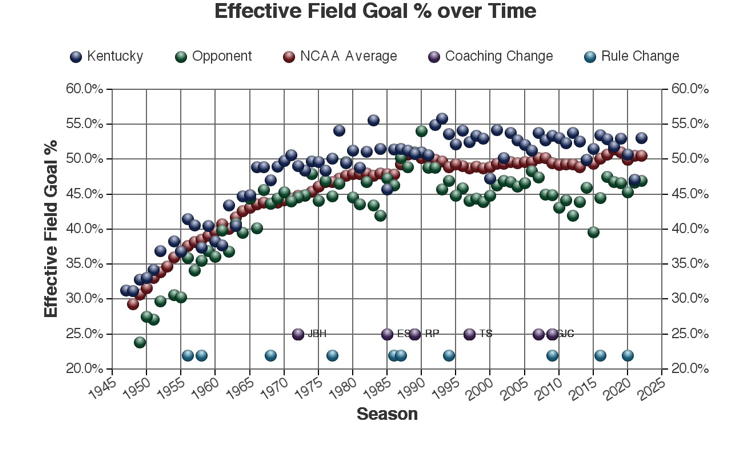
Effective Field Goal Percentage
Note: this measure is a different way to account for the 3-point shot. In this calculation, each three point shot made is given an additional bonus so that:eFG% = {(0.5 * 3pt FG + FG ) / FG Attempt}
Prior to the introduction of the three-point shot in 1987, the effective FG% reduces to the standard FG%. Note the jump in 1987 as three-point shots were now given additional weight.
 |
![]()
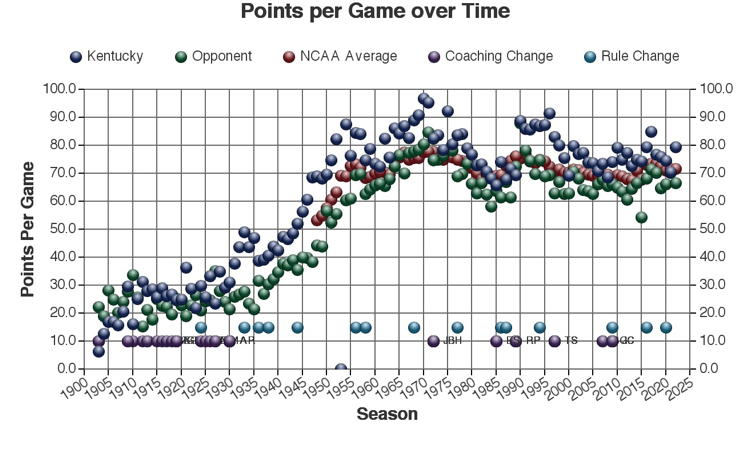
Points per Game
 |
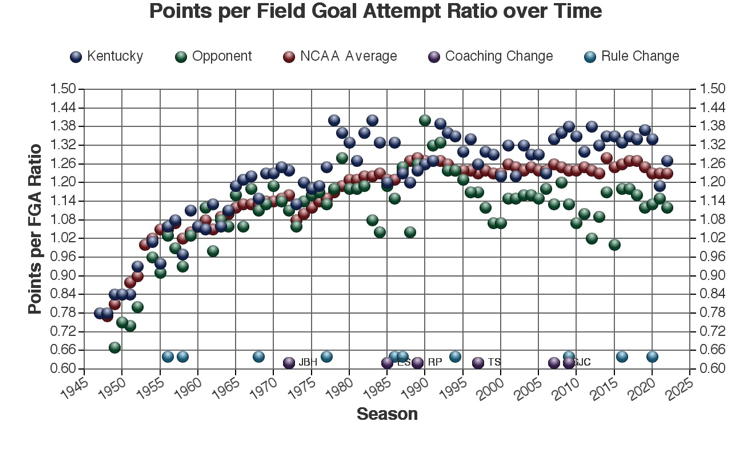
Points per Field Goal Attempt
 |
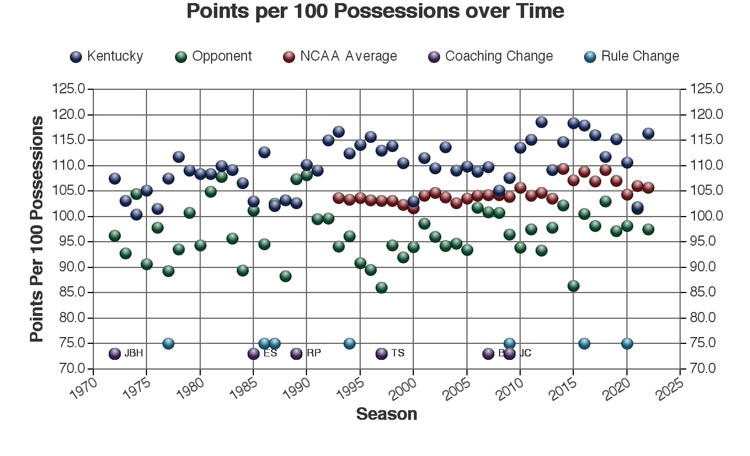
Points per 100 Possessions
 |
Net Points per 100 Possessions
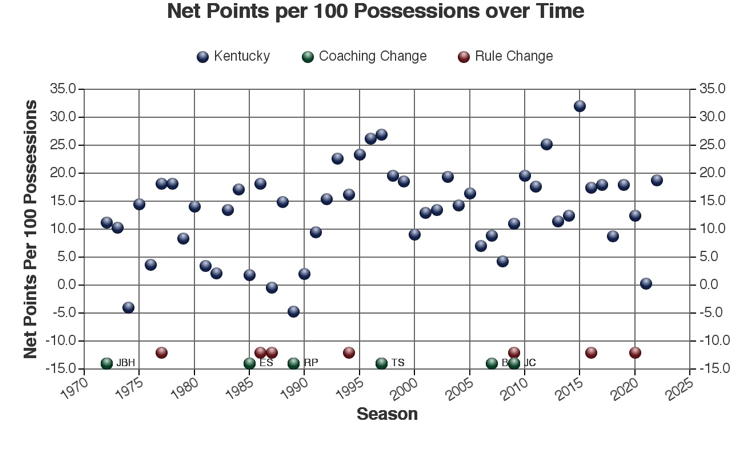 |
Note: This measure subtracts UK's opponents points per possessions from UK's points per 100 possessions. A positive value indicates an advantage for UK.
![]()
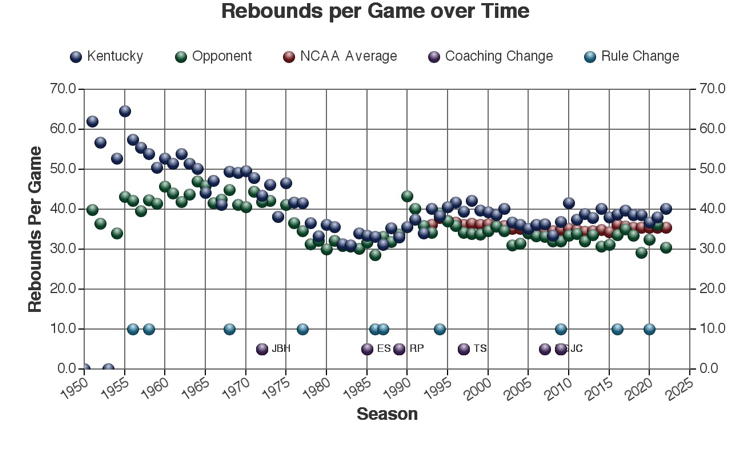
Rebounds per Game
 |
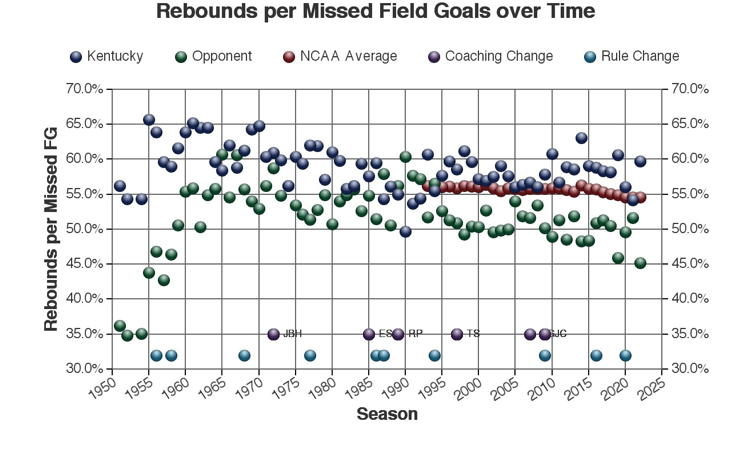
Rebounds per Missed Field Goal Attempt
Note: this measure calculates the number of rebounds a team has compared to the number of total missed shots in the game, i.e. the missed shots by both UK and their opponent. Also, the summation of these measures is greater than 1.0 due to the inclusion of rebounds off of missed free throws. The NCAA standard going back to 1993 is on average 0.560)
 |
Rebounds per 100 Possessions
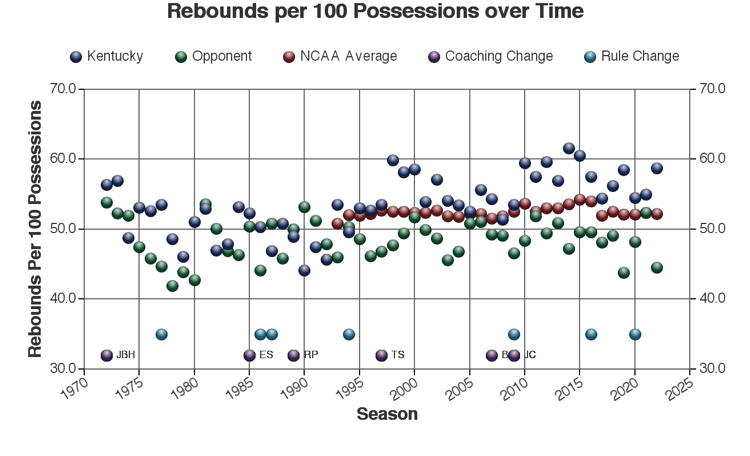 |
Note: Possessions are approximated for UK before 1993 and for NCAA according to the information noted previously on this page.
![]()
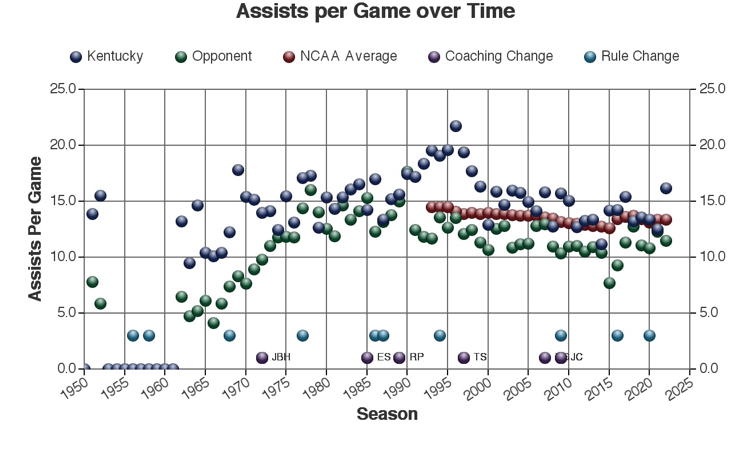
Assists per Game
 |
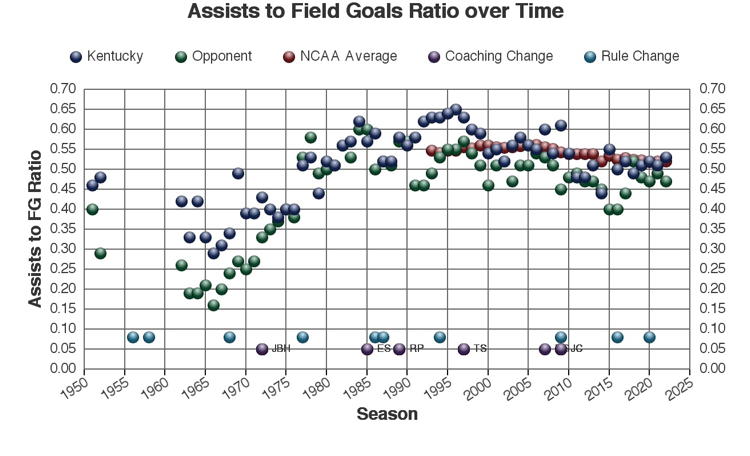
Assists per Field Goal Ratio
 |
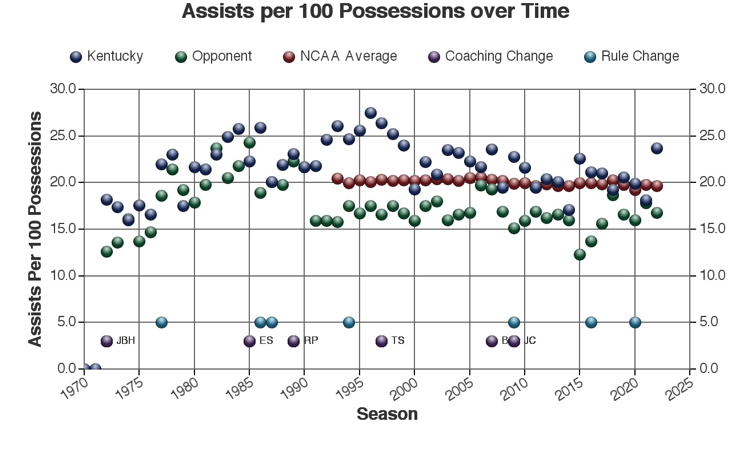
Assists per 100 Possessions
 |
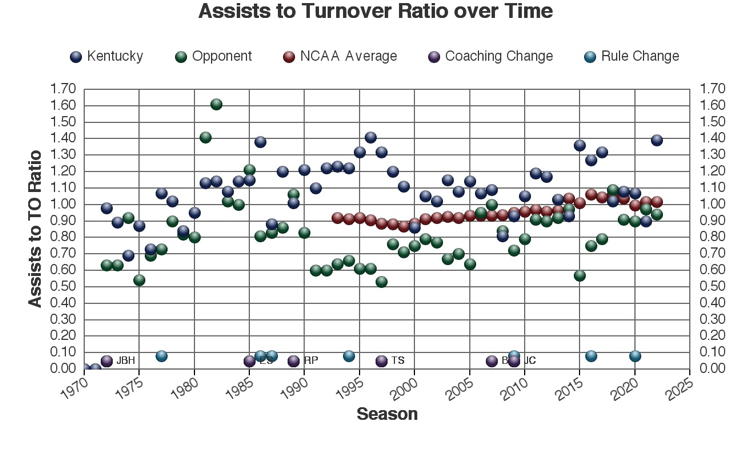
Assist to Turnover Ratio
 |
![]()
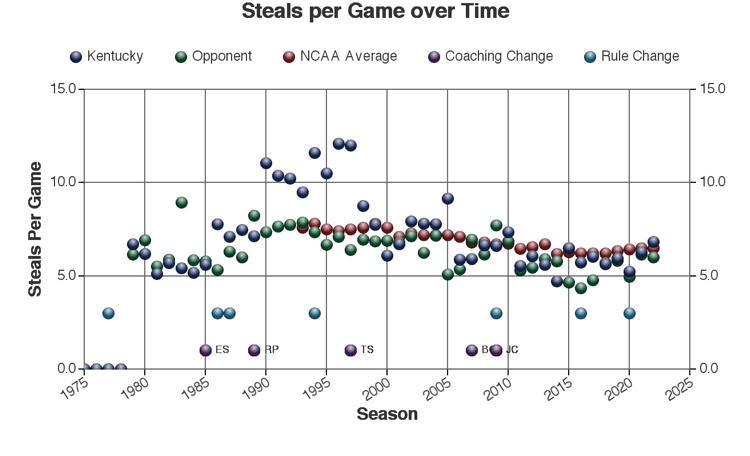
Steals per Game
 |
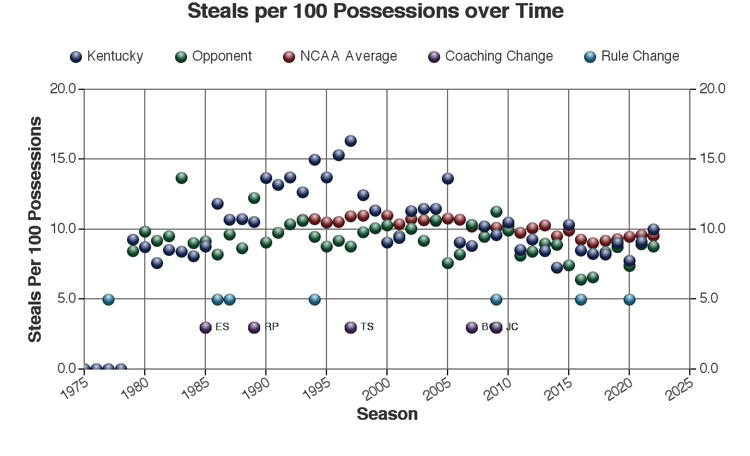
Steals per 100 Possessions
 |
![]()
Blocked Shots per Game
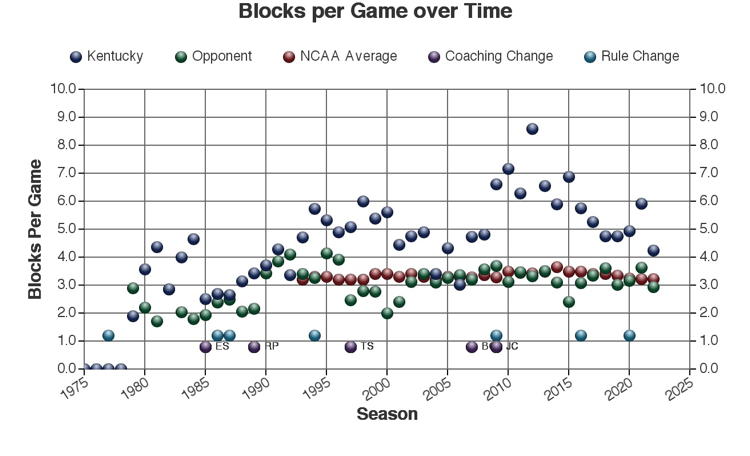 |
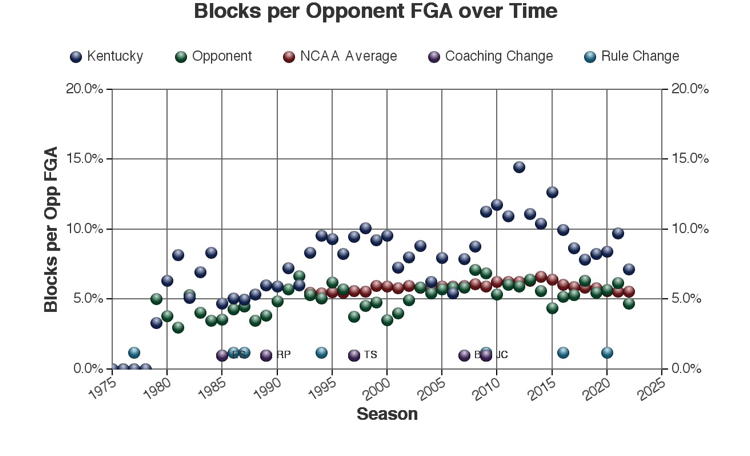 |
Blocked Shots per 100 Possessions
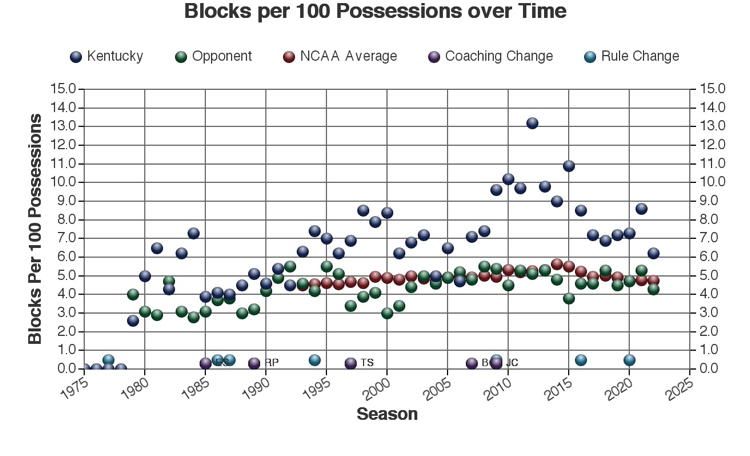 |
![]()
Turnovers per Game
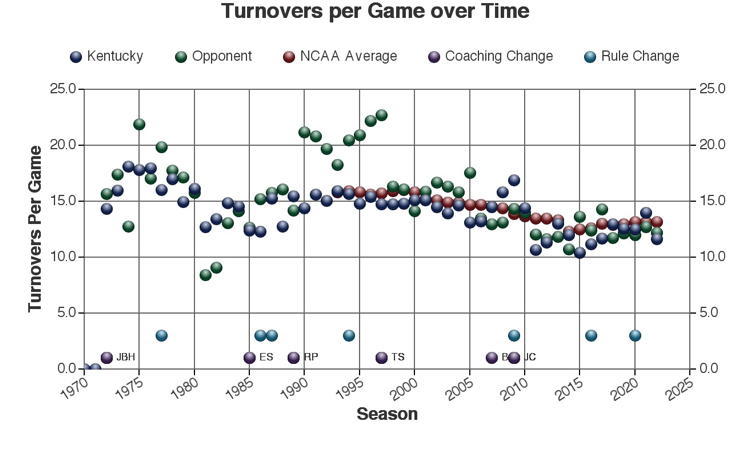 |
Turnovers per 100 Possessions
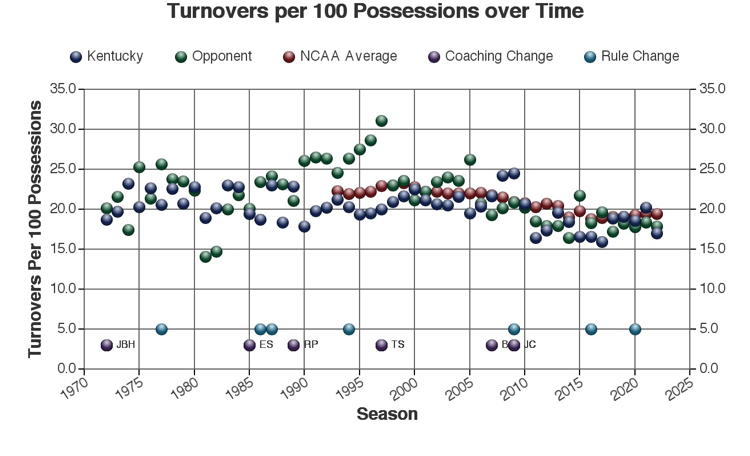 |
![]()
Personal Fouls per Game
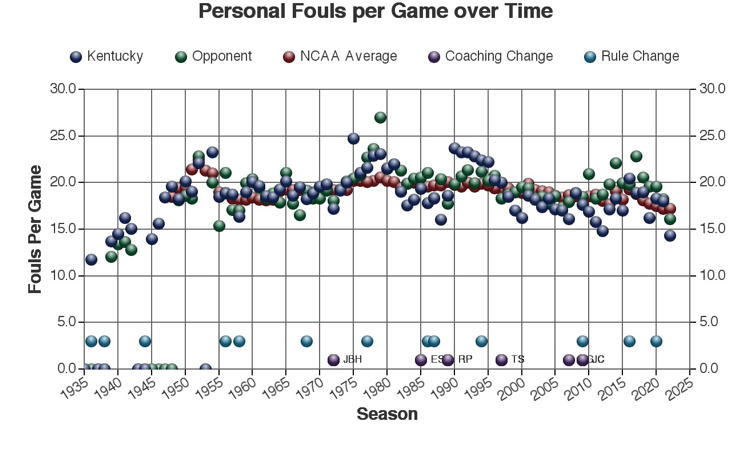 |
Personal Fouls per 100 Possessions
 |
![]()
3-pt FGA Tendency
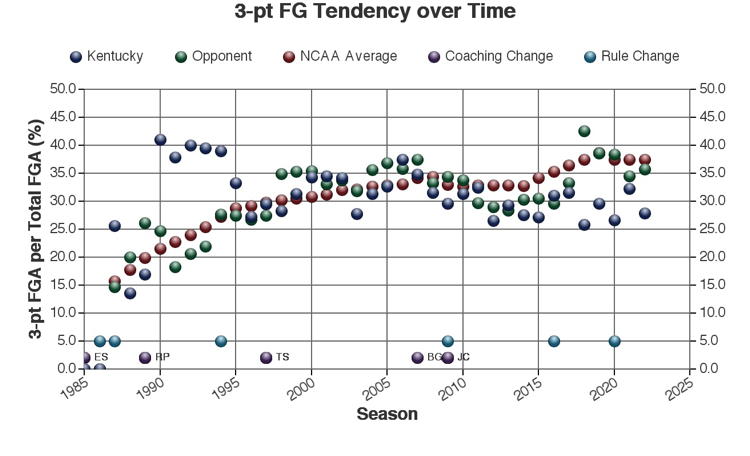 |
![]()
Return to Kentucky Basketball page, statistics, team schedules, team rosters, opponents, players, coaches, opposing coaches, games, assistance or search this site.
![]()