![]()
![]()
2009-10 NCAA Tournament Seedings & Results
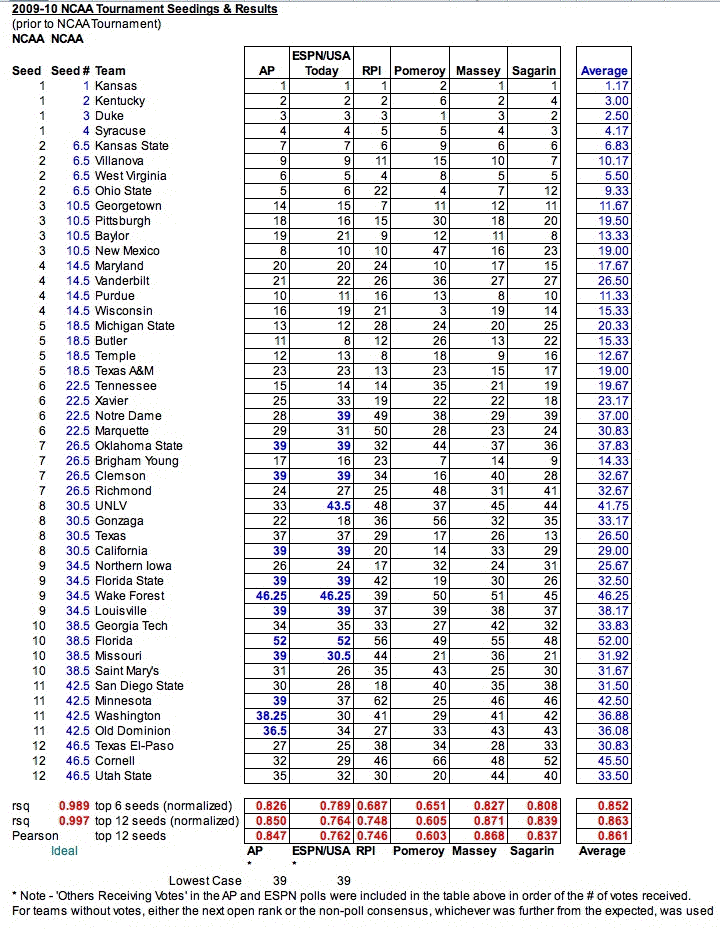
The table below shows the predicted rank of the top 47 teams (12 seeds not including New Mexico State) which were selected to the NCAA Tournament committee. The purpose is to compare various polls and ratings systems to see which method is most accurate in predicting the seeds the NCAA committee determined. Each rating system (RPI, Sagarin, Pomeroy & Massey Rating Systems along with the Associated Press sportswriters and ESPN/USA Today Coaches poll) was taken after the conference tournaments were completed (prior to the beginning of the NCAA Tournament) and the rank of each team was assigned to the teams which made the tournament. This data was then regressed against the average ranking a team of that particular seed would be expected to earn. (except for the #1 seeds where the committee did break down the specific order).
So for example, a number two seed would be expected to be one of the top five to eight teams in the tournament. They thus would have an average ranking of (5 + 6 + 7 + 8)/4 = 26/4 = 6.5. This approximation is used because it is generally unknown how the NCAA committee ranked teams within each seed. (and as illustrated by comments by the committee chairman in 2010, the S-curve is not faithfully followed and thus cannot be relied upon.)
The data was regressed and a measure of the error between the predicted and actual rank was determined by using the r-squared function (rsq). For those unfamiliar with this function, rsq can vary between 0 and 1.0, with the higher value indicating a better fit. Because each team is being regressed against an average ranking (and thus there are natural errors introduced), the very best regression that can be achieved is not an r-squared of 1.0 (which corresponds to zero error) but a lower value, shown at the bottom of the table. Because of this, the r-square of each model was normalized to that reduced value to account for the artificially introduced error.
[Note that it has been suggested that using the Pearson Correlation function ('CORREL' in Excel) may be more appropriate for this type of analysis. Using this gives nearly exactly the same results as what I found for the normalized r-squared analysis so I decided to keep the r-squared, mainly because more people are familiar with this and r-squared has been used in previous years so it's easier to compare results between years. If anyone has a better suggestion for how to correlate this data, please let me know at the address at the bottom of the this page.]
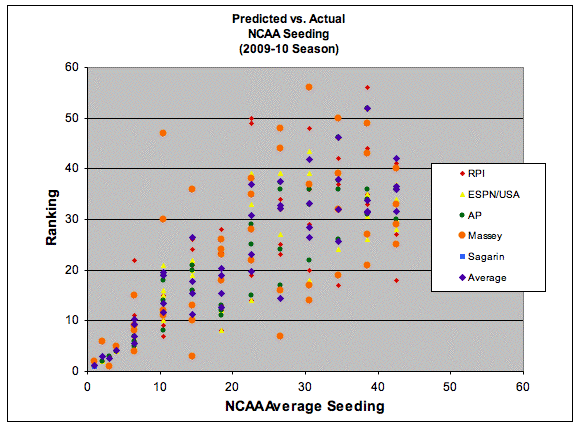
The plot below shows the difference between the predicted and actual seedings. A perfect fit would be a straight line through the center of the graph from the bottom left to the top right.
Preliminary Conclusions
1.) It appears that all the models and polls do a fairly good job of correlating to the actual committee decisions, both with respect to the top seeds and the entire at-large field. In particular Massey and Sagarin models did the best of the mathematical models (as opposed to Pomeroy and the RPI) while the AP poll did better than the ESPN/USA Today poll.
Unlike in some prior years, there was not a clear superiority of the human polls over the computer models, or vice-versa.
2.) Although the RPI was near the bottom of the polls and models, it was significantly better correlated (0.678 for the top-6 seeds, 0.748 for the entire at-large field) than it was the last time I did this type of analysis, namely nearly ten years ago for the 2000-01 and 2001-02 seasons. Back then the RPI r-squared value was around 0.47 for the top-6 seeds and .67 for the at-large field). Or in other words the RPI was very loosely (ie poorly) correlated, if at all, with the results at that time, but has shown significant improvement.
The reason for this is likely that in recent years, the NCAA has 'tweaked' the RPI to try to make it closer to reality. For example they decided to give a higher weight to games that are played on the road. Despite these improvements, the RPI still is not nearly the end-all and be-all in terms of predicting the tournament, like it's often portrayed in the media.
3.) As with previous seasons, an average of the polls and ratings provide a very good correlation with the actual seedings. The r-squared of the average (0.852) is superior to any individual model, as has been found in past years. The r-squared of the entire at-large field (0.863) is slightly less than the correlation of Massey (0.871) (the first time I've seen this happen where an individual measure bests the overall average) but still provides a very good correlation.
As in the past, this finding that the average rating gives a high correlation lends support to the notion that the committee takes into account many different factors from different areas of emphasis. The fact that utilizing disparate models enhances the correlation, underscores the fact that the committee utilizes a number of factors when determining who makes the field and how they're seeded. This is in line with what they've always claimed in interviews.
![]()
There are other aspects of these results which can be considered, namely how well the models predict teams that were invited to the field , and whether the models accurately predicted teams that didn't get invited by the NCAA committee not making the final cut.
In the first case, the following set of tables look at the top-50 teams that each model predicted (the top 47 in this case made the at-large field) and note the teams that were predicted to be in the field but weren't invited by the committee.
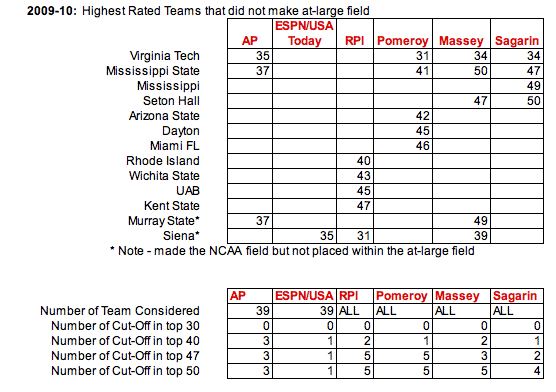
Conclusions: The polls do not typically reach into the bubble teams so their results are not really meaningful, other than to note that there were cases (3 in the AP poll, once in the ESPN poll) where teams received votes but were not placed in the at-large field.
In terms of the mathematical models, Sagarin's model did the best in terms of not including teams which did not ultimately make the field. The only miss, and one which all the other models also missed on (save the RPI) was Virginia Tech. In terms of strength, Pomeroy, Massey and Sagarin all had Virginia Tech solidly in the field. The RPI, which is more a quasi-strength of schedule rating than a traditional power rating (see this link for more information), listed Virginia Tech outside the field at #59. This is in accordance with the thought by pundits that Virginia Tech was passed over due to their poor schedule strength, particularly out of conference.
In the next case, teams that did make the field, but didn't show up within a model's top 47 teams are highlighted.
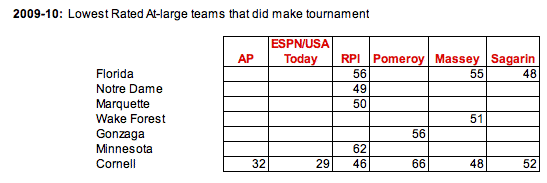
Conclusions: Again, in this case, the poll results are typically not relevant since they generally don't reach near the bubble teams, much less beyond.
In terms of the mathematical models, again the best model was Sagarin, who had Florida just out of the at-large field at #48. The NCAA Committee had Florida solidly in the tournament as a #10 seed, although that was questioned by pundits and when compared to other bubble teams (such as Mississippi State), it's not clear that Florida was demonstrably better than these other teams on the bubble.
The model that showed the most variation was the RPI. Again, this is not surprising given that the RPI really isn't a traditional power ranking like the other models. The RPI was originally designed around, and thus is more susceptible to the influence of schedule, rather than necessarily how strong the team actually is. (see the following page for more information on this.)
Aside: It is noteworthy that in the past I have questioned the media hype surrounding the RPI, given that in the past the RPI has consistently been a terrible to poor predictor of the NCAA Tournament field. Knowing that the RPI was originally designed to highlight and reward bubble teams that played difficult schedules, and knowing how the RPI was calculated (such as the fact that 75% of the original model was based not on how well a team performed on the court but who they scheduled) I never thought the RPI rating should be used for anything but comparing bubble team's schedules (which again, is what it was originally designed to do), and criticized the many fans and media members who misused the measure for other purposes (basically if they used the RPI as a substitute for team strength, then they were misusing it).
With the recent changes by the NCAA to 'improve' the RPI by giving additional weight to road games, they have made the model more realistic and closer to a true power rating, but still severely lacking in some respects (such as still not including margin of victory). By the numbers above, it appears that the RPI's correlation with the NCAA has indeed improved, but it still is a poor predictor in comparison to other models, such as Sagarin and Massey and the AP poll, who were explicitly designed to determine the strongest teams, unlike the RPI.
If the RPI is not good for predicting the overall NCAA Tournament field and seeding, then what good is it for? One would think it would be good for its original purpose (ie highlighting and rewarding bubble teams for difficult schedules) but given the additional tables above looking at the bubble teams, it's not clear that the RPI is very good at that either. Again, the most variation in terms of which bubble teams actually made the NCAA's field versus the bubble teams that were left out of the field came from the RPI, whereas other measures did a better job at this. (The only exception may be Virginia Tech which according to most measures was strong enough to be in the field, but was left out by the NCAA, due likely to its weak schedule, which was reflected by the RPI.)
Based on this data, it appears the RPI isn't good for much of anything. Why it's become the most important factor cited by numerous talking heads and media members is probably more a result of herd mentality than anything substantive.
Also note that in the table above, Cornell is included, mainly because it's an oddity as it's not clear whether they earned their #12 seed in the at-large field or as their status as an automatic qualifier. (in comparison, New Mexico State, which was the final #12 seed (#48) clearly would not have made the field as an at-large team.) The polls considered Cornell to be solidly in the field, while other models (RPI, Massey and Sagarin) considered them to be on the bubble (as an at-large team) and Massey had them well out of contention if they had been an at-large team.
![]()
One Last Comparison
One final comparison is included as a way to bring home the power of averaging the above disparate models. One favorite pastime of some is to look at "Bracketology" and try to determine who makes the field and who doesn't. There's even been a cottage industry of 'bracketologists' who claim to be experts in the topic.
The below table looks at the predicted field of at-large teams against the field chosen by the NCAA committee, based on averaging the above results and reordering the teams accordingly. Over a dozen additional teams were included, teams which were on or near the bubble, in order to see if they might have been overlooked.
Below are the results from reorganizing the teams based on the average rank.
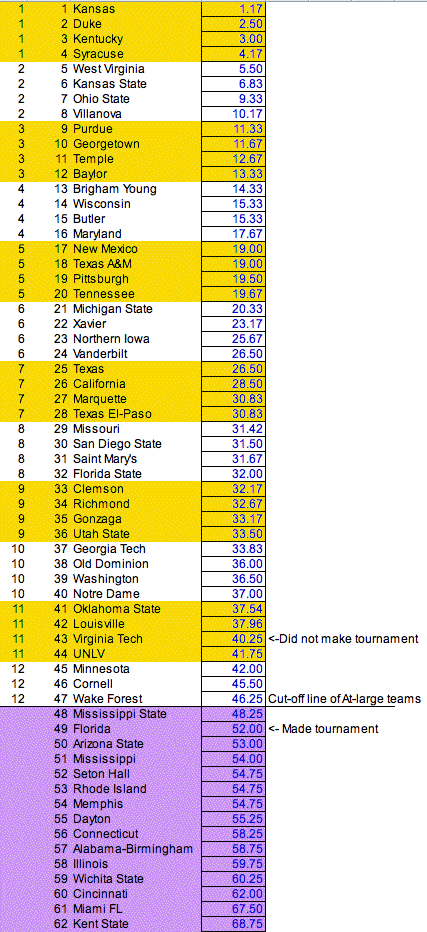
What is found is that the results of who made the field and who didn't are nearly perfect with the NCAA-chosen field, right to the cut-off of 47 teams. (teams left out of the tournament are shown in purple) The only 'mistake' is Virginia Tech, which was predicted to be in the field as an 11th-seed while Florida was predicted to be just outside of the field. These just happened to be two of the most questioned choices by the pundits to the NCAA committee.
In other words, the above analysis gave just as good a prediction of who made the field and who was left out as most of the professional bracketologists. For example, Joe Lunardi also correctly picked the field with one exception. In his case, he included Illinois as a #12 seed at the expense of Florida.
![]()
Last Updated May 14, 2010
Return to Kentucky Wildcat Basketball Page or RPI Page.
Please send all additions/corrections to