![]()
![]()
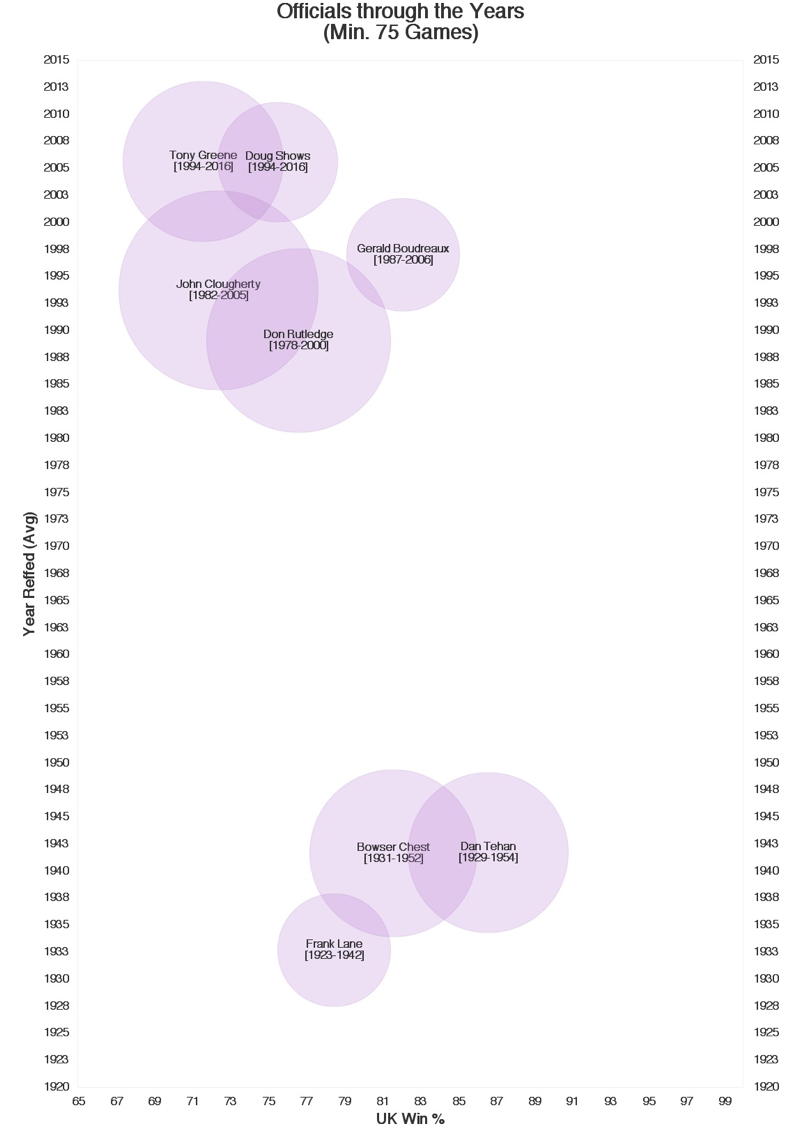
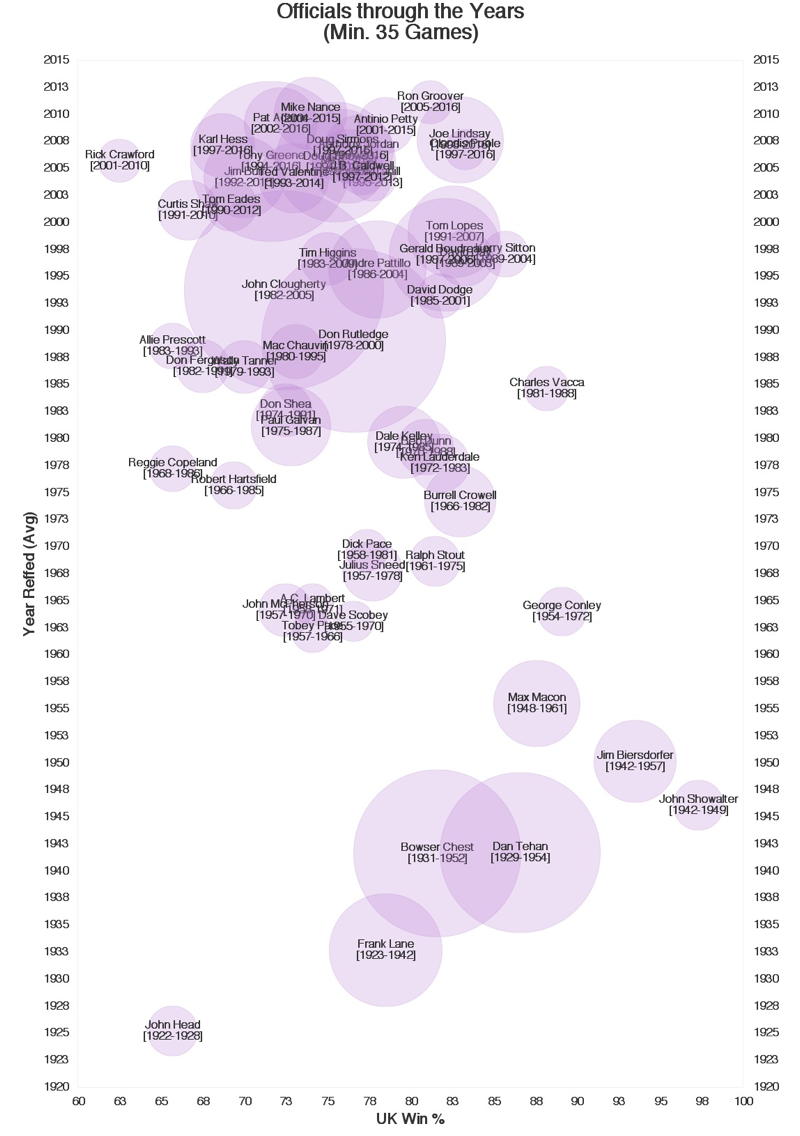
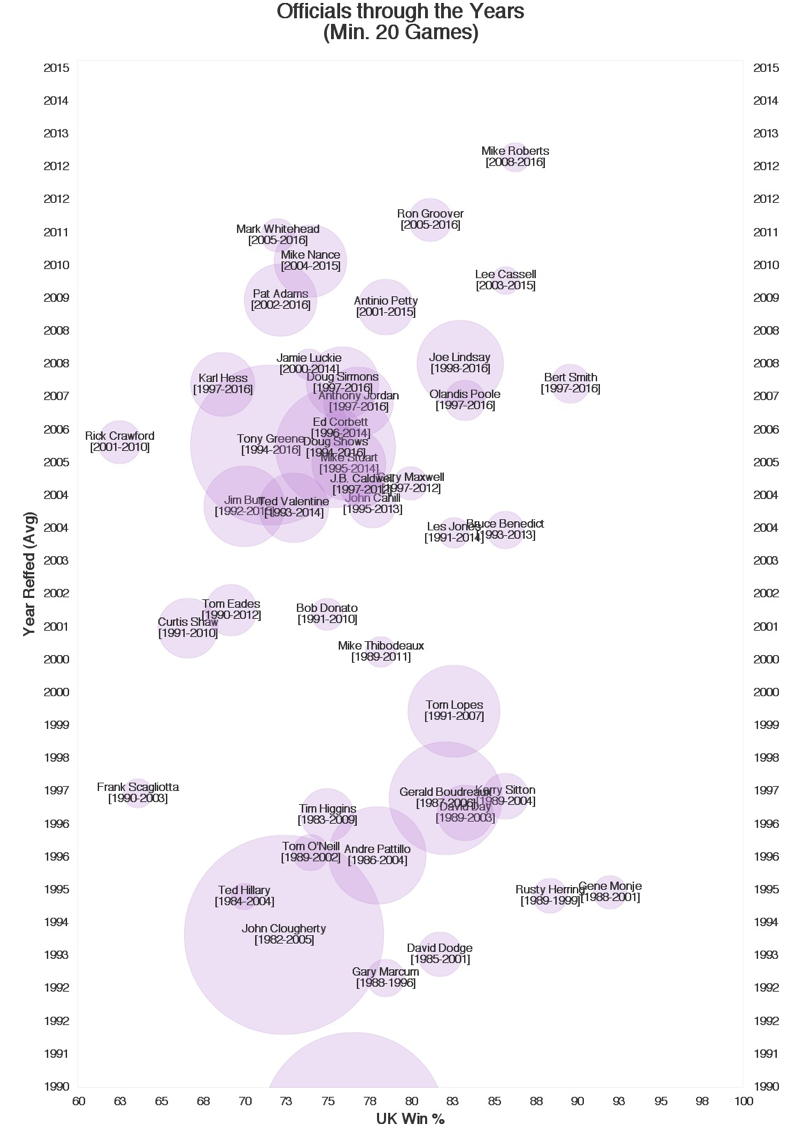
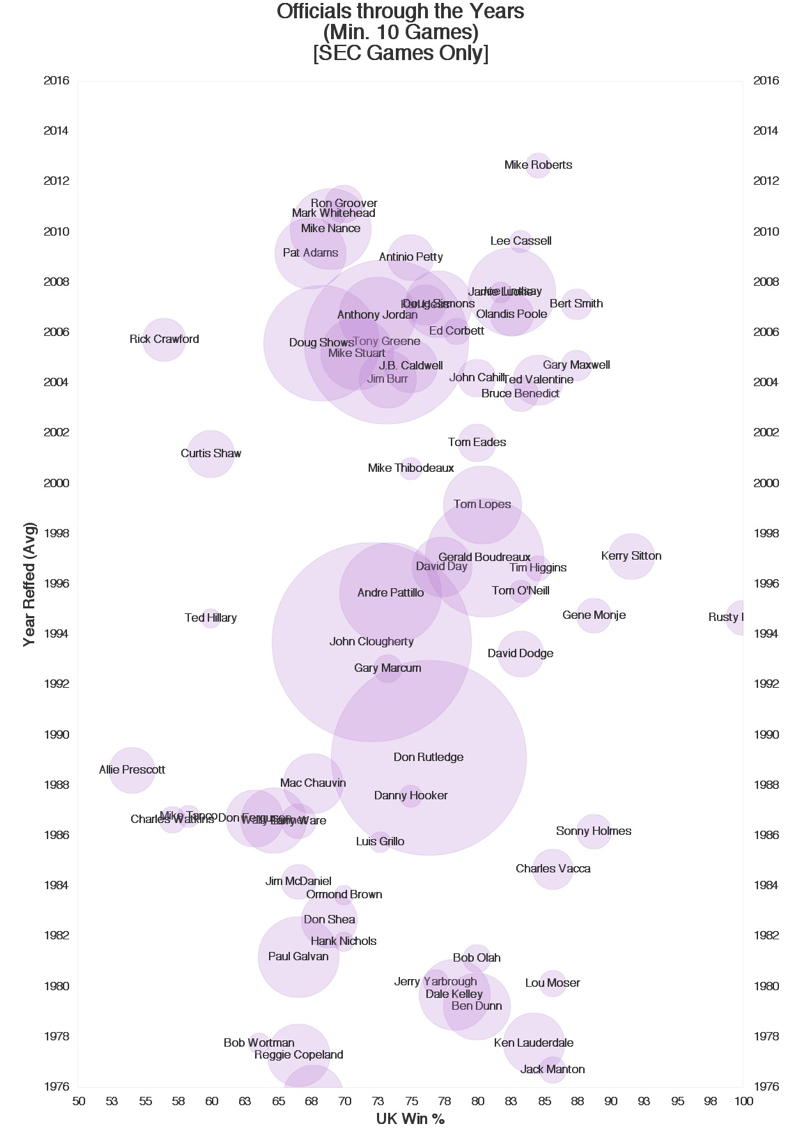
The below charts are intended to provide a novel way of viewing historical information about key referees of the past who officiated in games which Kentucky participated in.
The first set of charts show the names of key referees at the mid-point of the dates of games they refereed in on the y-axis. The x-axis represents Kentucky's win percentage in games that they reffed. The size of the associated bubble is proportional to the number of UK games that the particular referee called.
Specifics on the time frame, number of games and links to individual officials can be accessed from this page.
 |
 |
 |
 |
![]()
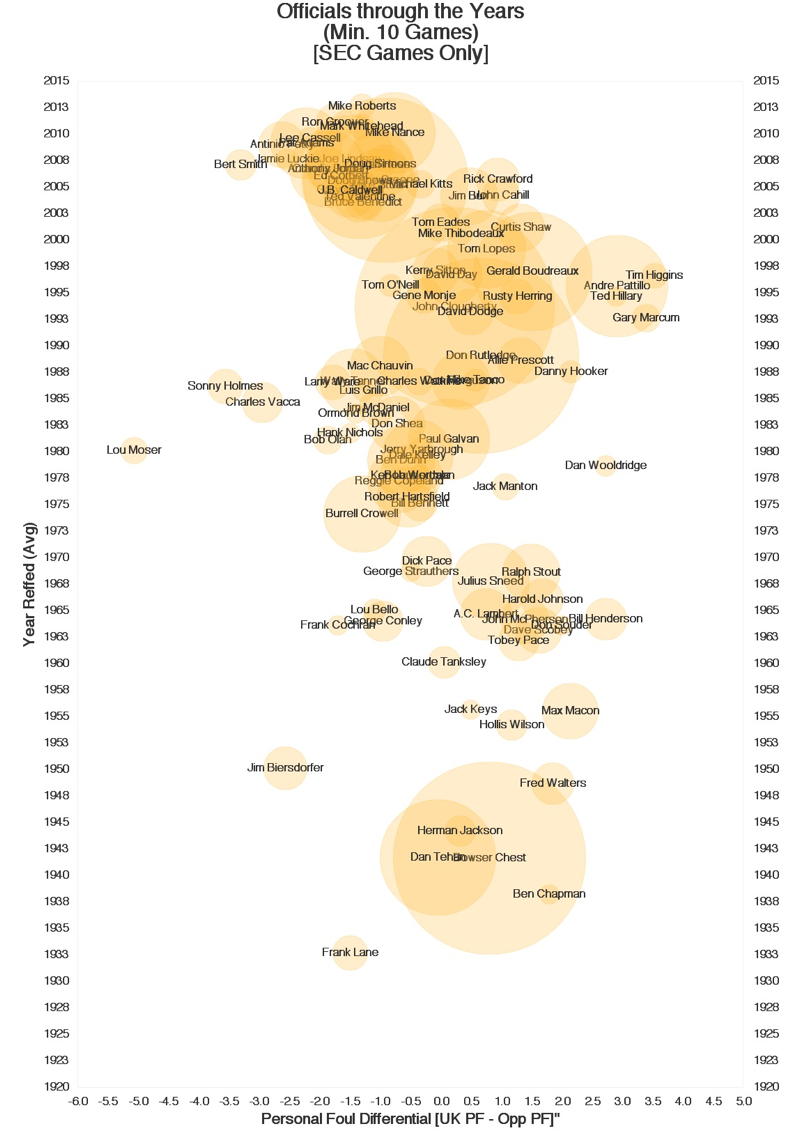
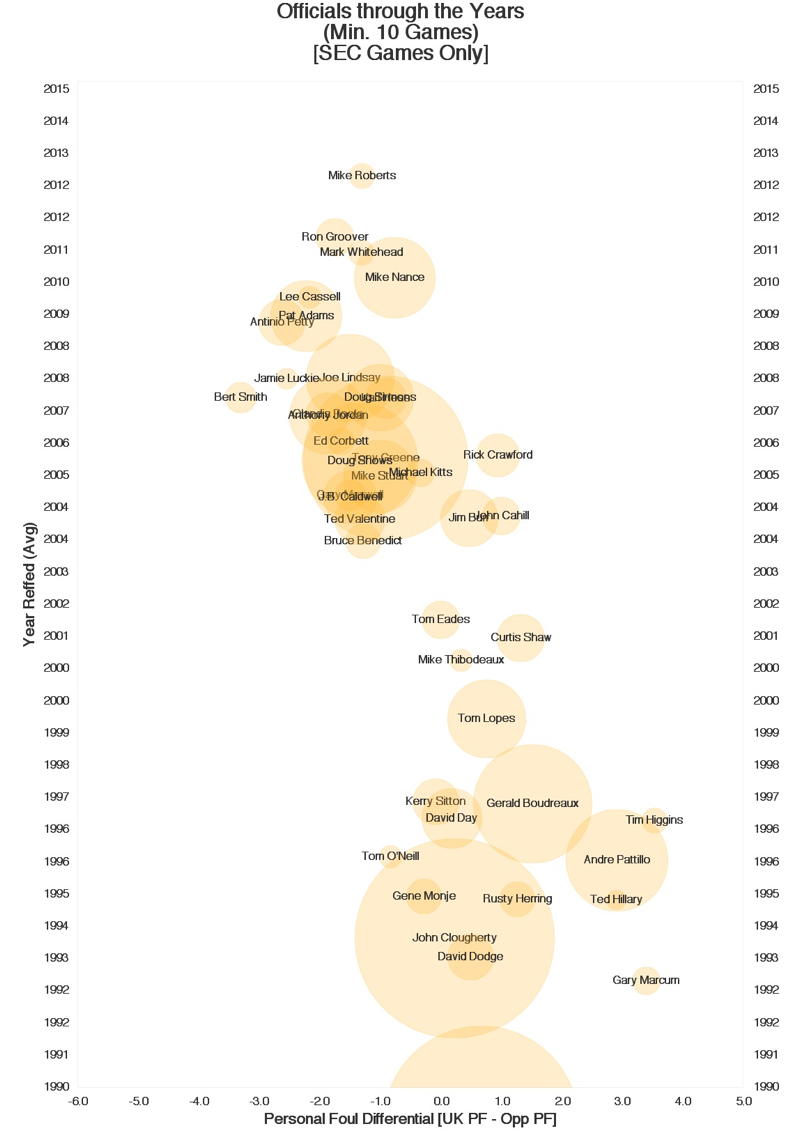
The second set of charts looks at discrepancies in personal fouls called. A positive differential indicates that more fouls were called on UK than their opponent. A negative differential indicates the opponent was called for more fouls than UK. In order to help normalize opponent strength, only SEC games are considered.
 |
 |
![]()
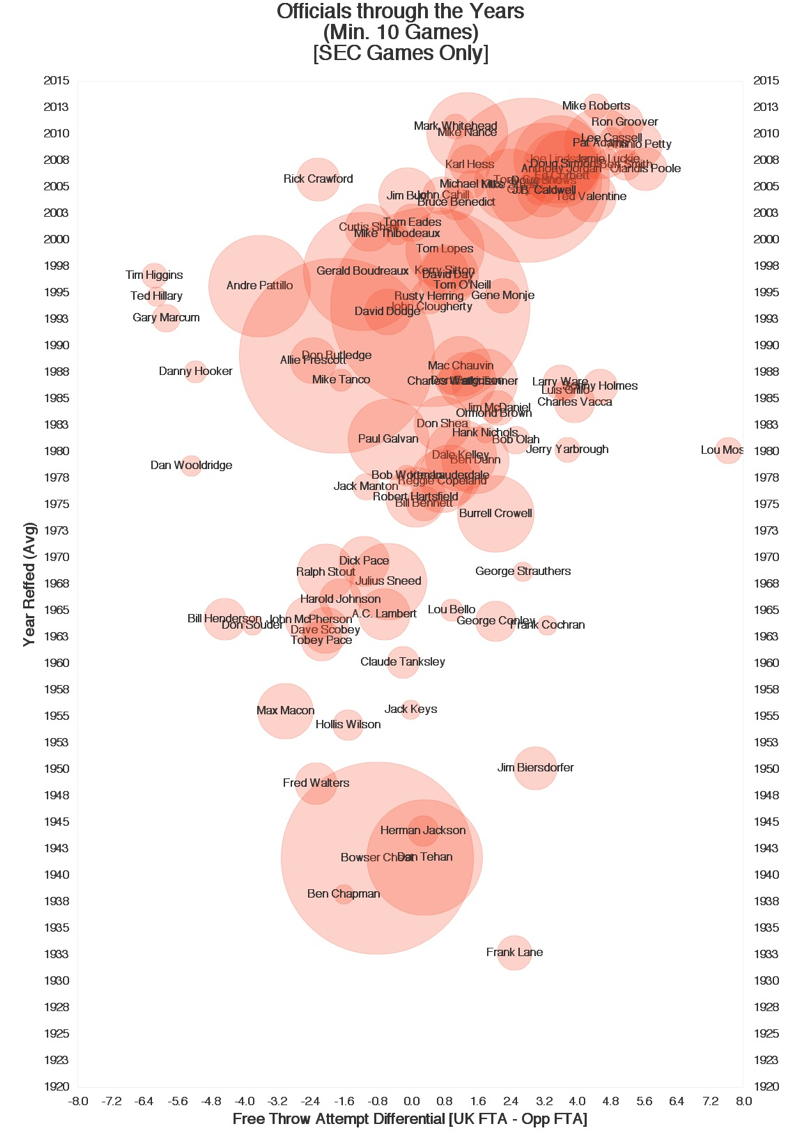
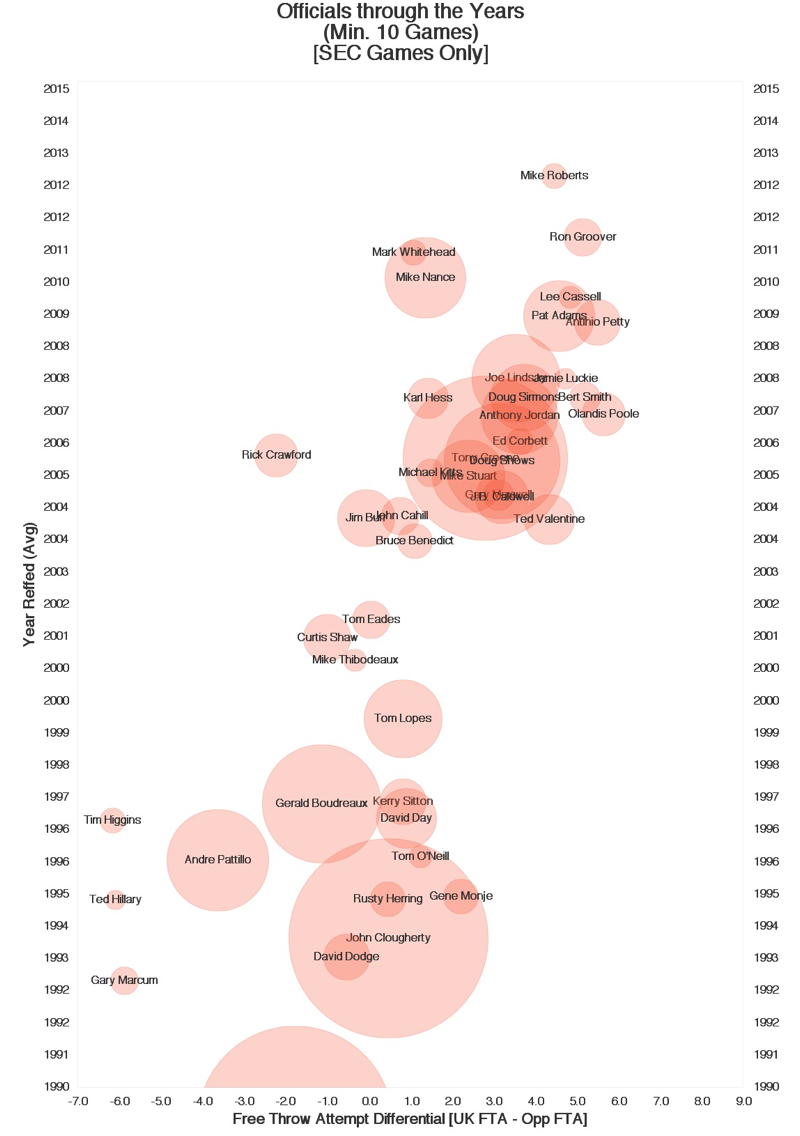
The third set of charts looks at the differential in free throw attempts, where the difference between UK FTA's and their opponents FTA are taken. A positive number indicates UK has attempted more free throws than their opponents. Again only SEC games are considered for these charts.
 |
 |
![]()
Return to Kentucky Wildcat Basketball Page or Kentucky Statistics Page.
Please send all additions/corrections or suggestions for additional graphs to