![]()
![]()
| Background | Wins | Losses | Percentages |
![]()
Background
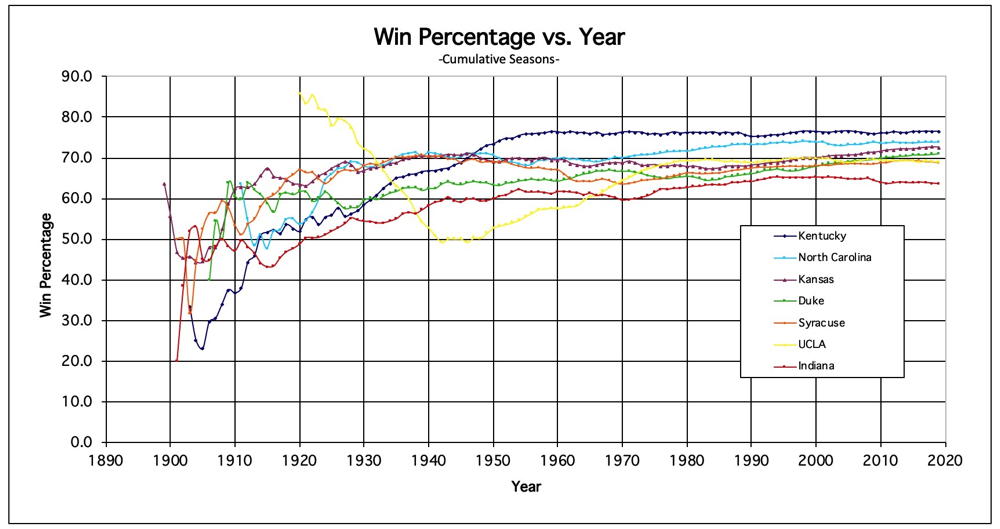
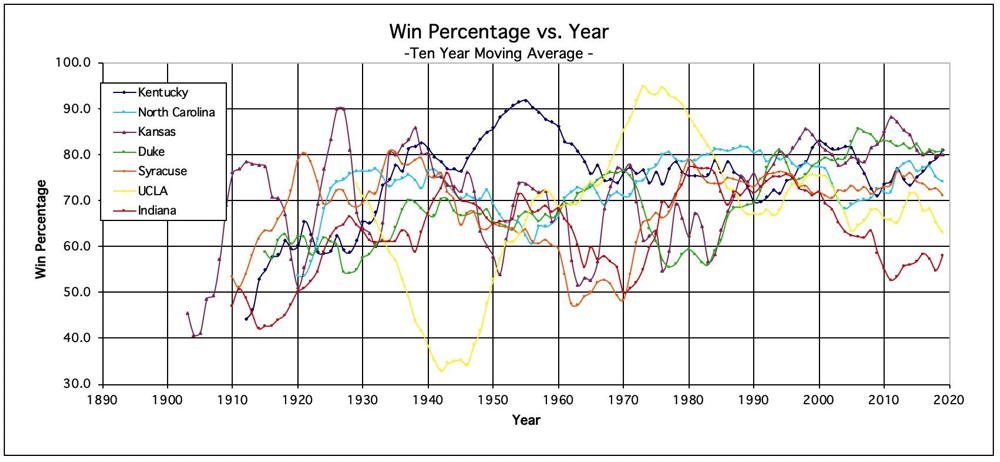
Below are some historic trends showing how Kentucky has fared against the top basketball programs historically. The information comes from historical NCAA information provided on their official website (Direct link) along with yearly totals found in media guides of the respective schools.
Included in the results below are the acknowledged top six programs of all-time: Kentucky, North Carolina, Kansas, Duke, Indiana and UCLA (in no particular order) along with Syracuse which is #5 in all-time wins. UCLA and Indiana are not in the top-5 in terms of all-time wins, however they are included due to their tradition and other factors. The table below provides the top-10 programs in terms of wins (through 2013). For current-season standings, please check the following page. For an up-to-date tally of Kentucky's all-time record, you can check the current year's schedule. For a historic look at the top-10 all-time win leaders at the end of each decade, please check this page.
(List as of the end of the 2018-19 Season) | |||||||
| # | School | First Season | Years | Won | Lost | Tied | Win % |
|---|---|---|---|---|---|---|---|
| 1 | Kentucky | 1903 | 116 | 2,293 | 706 | 1 | 76.5 |
| 2 | Kansas | 1899 | 121 | 2,274 | 865 | 0 | 72.4 |
| 3 | North Carolina | 1911 | 109 | 2,261 | 799 | 0 | 73.9 |
| 4 | Duke | 1906 | 114 | 2,176 | 887 | 0 | 71.0 |
| 5 | Temple | 1895 | 123 | 1,926 | 1,079 | 0 | 64.1 |
| 6 | Syracuse | 1901 | 118 | 1,904 | 908 | 0 | 67.7 |
| 7 | UCLA | 1920 | 100 | 1,887 | 852 | 0 | 68.9 |
| 8 | Notre Dame | 1898 | 116 | 1,880 | 1,028 | 1 | 64.6 |
| 9 | St. Johns (NY) | 1908 | 112 | 1,854 | 1,029 | 0 | 64.3 |
| 10 | Indiana | 1901 | 119 | 1,836 | 1,034 | 0 | 64.0 |
Note - This information is per the NCAA official statistics. The data may differ from the school's individual records.
![]()
Total Wins
The above chart is also broken down into various time-periods to better show some of the placements and years where teams overtook others.
Important Note: These charts shows how the current top teams fared historically. For a view of who the leaders were at the time (including numerous schools which no longer compete for the all-times win lead), please consult this page.
1900-1930 - Kansas breaks on top, Syracuse makes a good showing, UNC gains momentum, UCLA gets a late start.
1930-1950 - Kentucky makes its move
1950-1980 - Kentucky overtakes Kansas, Indiana and Syracuse falters, Duke passes UNC briefly, UCLA makes up ground
1980-2010 - Kentucky and North Carolina battle for #1, Kansas stays in the hunt and takes advantage as Carolina falters briefly, Duke makes a strong push
1900-2020 - Kentucky, Kansas and North Carolina all view for the top spot while Duke lurks behind.
Wins vs. Games Played
![]()
Total Wins vs. Total Losses
Losses vs. Games Played
![]()
Overall Cumulative
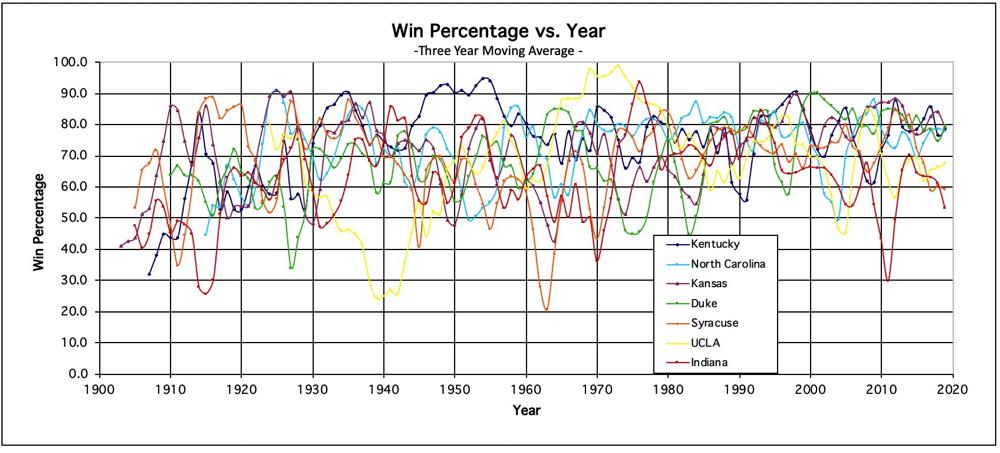
Three-year rolling average
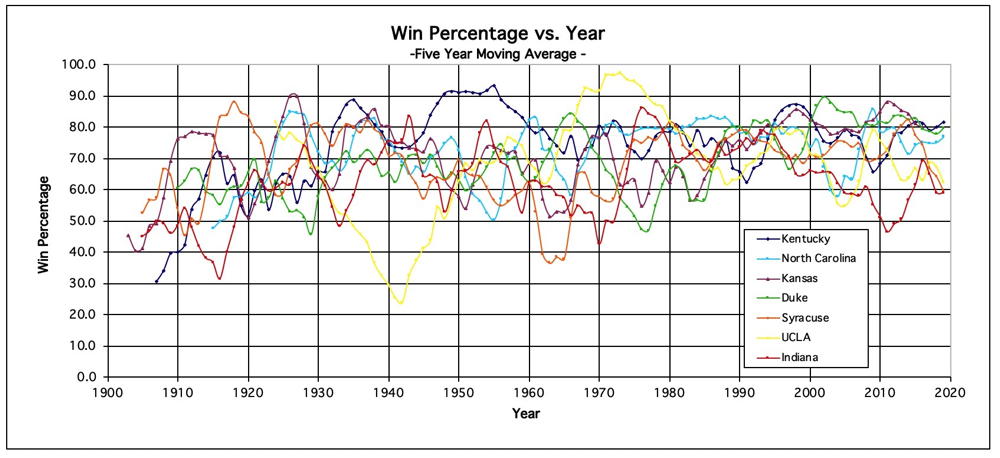
Five-year rolling average
Ten-year rolling average
![]()
If there are additional graphs you would like to see or any comments or interesting findings you see in the graphs, feel free to with any corrections or additional information. Return to Kentucky Basketball page, statistics, team schedules, team rosters, opponents, players, coaches, opposing coaches, games, assistance or search this site.
![]()